Book a Demo burger-menu-icon
Book a Demo

Your Smart Bidding is optimising perfectly. For page views.

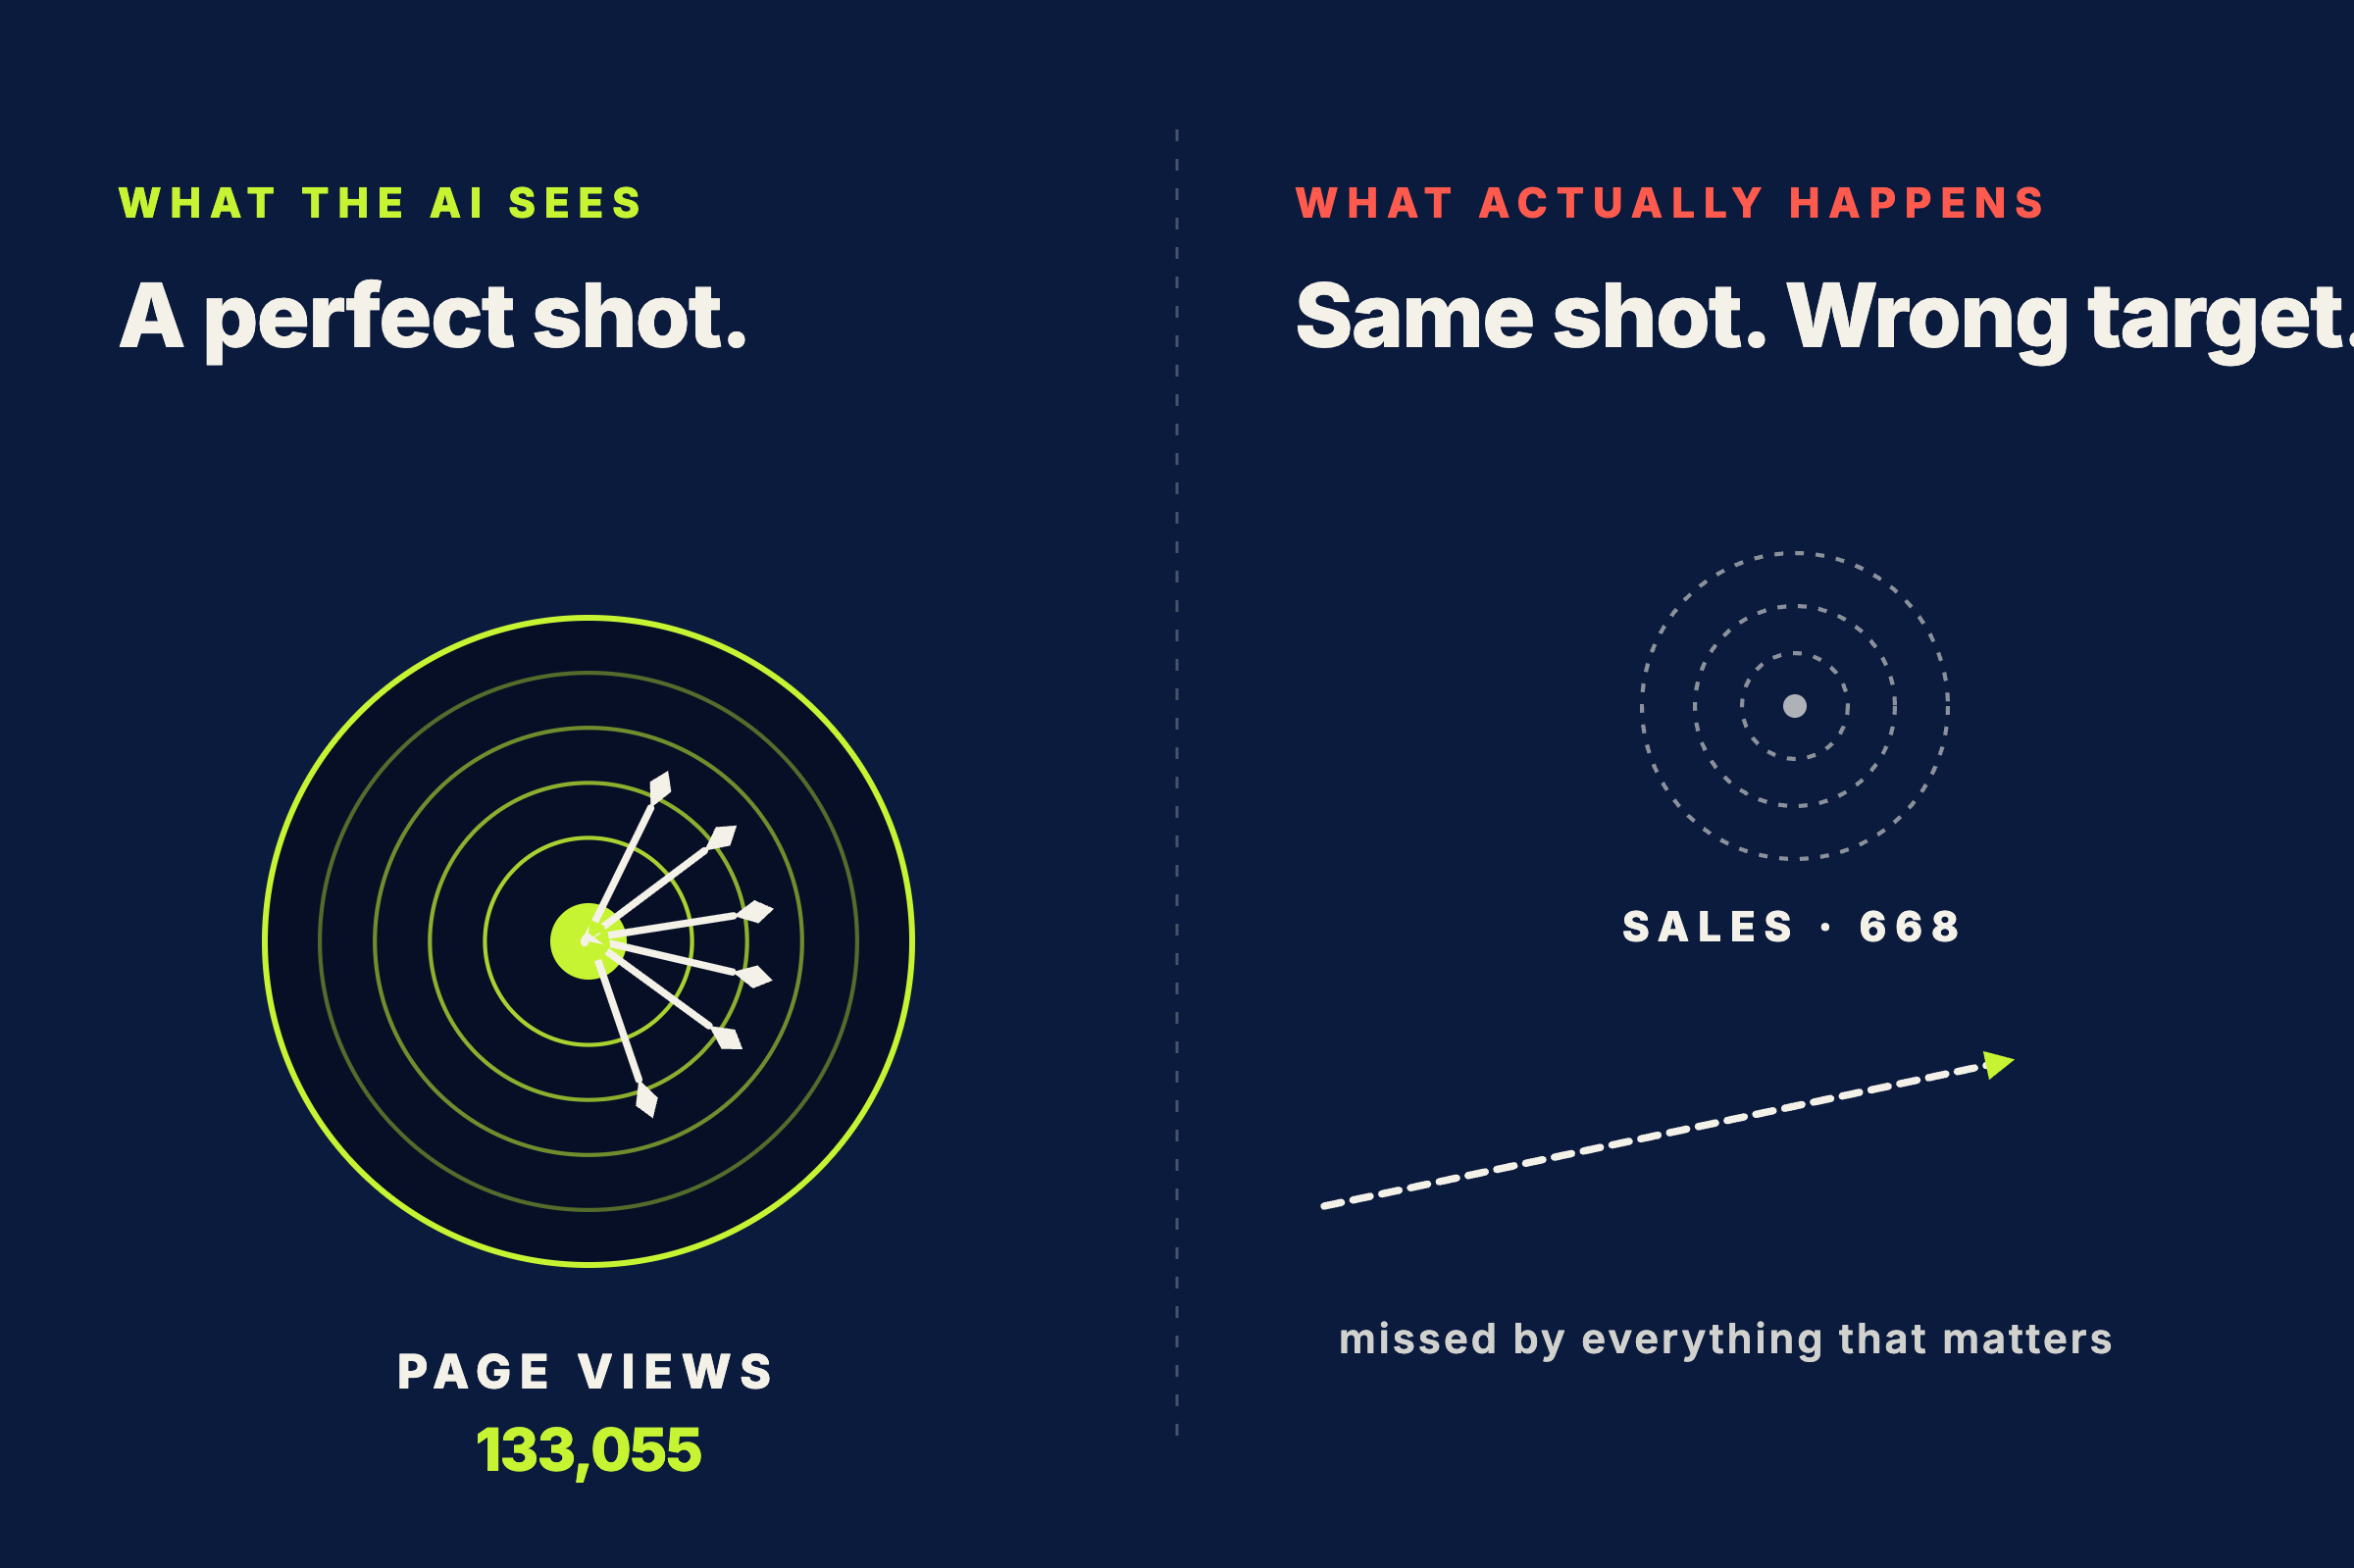
Split screen comparing two targets. On the left, an archery target labeled PAGE VIEWS shows all arrows hitting the bullseye with the number 133,055. On the right, a tiny faint target labeled SALES (668) sits in the distance with one arrow flying past, captioned 'missed by everything that matters'.

A 133,055-conversion month that produced 668 sales

In April 2026, one of our clients — a Nordic sports retailer running Google Shopping campaigns across Europe — saw 133,055 conversions in their Google Ads dashboard. The reported conversion value was 6,478,582 SEK on 129,520 SEK of spend. A 50x ROAS month.

Their actual sales count for April, measured server-side through Digger: 668 orders, 1,164,176 SEK in revenue. A real ROAS of 9x.

9x is a great month for an e-commerce business. 50x is not what happened. The dashboard number was 199 times higher than reality — and that mismatch doesn’t just inflate a vanity metric. It directs the AI that decides how the budget gets spent.

This is a story about what Smart Bidding actually optimises for when nobody has audited the conversion configuration in two years. We’ve seen it in two of the eleven e-commerce accounts we analysed for this study. The other nine have the opposite problem, which we’ll get to.

What Smart Bidding actually optimises for

When you switch a Google Ads campaign to Maximize Conversions or Target ROAS, you hand over budget control to a machine learning model. That model bids on clicks most likely to produce a “Conversion.”

The word “Conversion” sounds self-explanatory. It isn’t. In Google Ads, a Conversion is whatever you’ve configured a Conversion Action to be. It could be a purchase. It could be an add-to-cart. It could be a page view. The system will obediently optimise toward any of these — it just needs to know which.

For the account in our case study, here’s what Google Ads counted as a “Conversion” in April:

Conversion actionCategoryTimes firedRecorded value
Page ViewPAGE_VIEW129,349126,644 SEK
Begin CheckoutBEGIN_CHECKOUT1,2272,857,501 SEK
Add to CartADD_TO_CART1,2242,577,392 SEK
Add Payment Info(other)715707 SEK
Purchase (Google tag)PURCHASE326525,785 SEK
Purchase (server-side)PURCHASE215390,552 SEK
Sum reported as “Conversions”133,0556,478,582 SEK

Ninety-seven percent of those “conversions” were page views. Not sales. Not even cart actions. Just page loads. The remaining three percent were funnel signals — add-to-cart, begin checkout, add payment info — events that happen on the way to a sale but are not a sale.

Actual purchases as counted by Google’s own Purchase action: 326. Counted by the server-side pixel: 215. Both numbers are well below the 668 the back office actually recorded — likely because client-side tags are blocked by iOS Safari, cookie consent declines, and ad blockers on a meaningful share of buyers. That’s a separate failure mode, and a separate story.

The point for now is simpler: Smart Bidding doesn’t know any of this. It treats the 133,055 figure as the target and allocates budget accordingly. The algorithm bids most aggressively for clicks likely to produce page views — because that’s the volume signal — and only marginally for clicks likely to complete a checkout.

The audit that surprised us

We’ve been analysing the conversion configuration of every account under our MCC for an internal series on attribution accuracy. Eleven of those accounts are e-commerce (Shopify and WooCommerce). For each, we pulled the full set of Conversion Actions from the Google Ads API along with their April fire counts.

Two of the eleven had funnel events configured as Conversions. The example above was the more extreme of the two — 99% of its counted conversions came from non-purchase categories. The other had Begin Checkout firing as a primary conversion, accounting for 92% of its counted conversions.

The other nine had clean configurations. One Purchase action. Reasonable click windows. No funnel events. No page view tracking masquerading as conversion tracking.

Those nine accounts have the inverse problem — and the size of the gap is comparable, just in the opposite direction. More on that shortly.

Why this happens

If you’ve ever set up Google Ads conversion tracking with one of the standard wizards — particularly the Google Shopping App or Google Tag Manager templates — you’ve likely been offered a default set of event tags that include Page View, Add to Cart, Begin Checkout, Add Payment Info, and Purchase. The wizards make it easy to enable all of them. They don’t make it equally easy to think about which of those should count toward the metric Smart Bidding bids on.

Two years ago, when the Performance Max rollout pushed agencies to enrich their conversion signals to help the algorithm learn faster, this default became common advice. More conversion signals were supposed to give Smart Bidding more data points and faster optimisation.

What actually happened, in cases like the one we audited, is that every funnel step started being counted toward the bidding signal. Each customer journey contributed five or six “conversions” — page view, add to cart, begin checkout, payment info, purchase (sometimes twice). A buyer who visited four product pages before purchasing counted as nine conversions, not one.

Smart Bidding then optimised toward maximising that count. Which means it optimised toward maximising page views. Which is not what the business owner wants.

What it costs

The direct financial cost of this misconfiguration is hard to isolate in a single number, because it shows up as opportunity cost — budget that could have gone to high-intent search but went to high-volume display impressions instead. Smart Bidding is a redistribution machine, and a bad signal redistributes budget toward the wrong places.

A rough sketch from the case account: the campaigns with the highest reported “conversion rates” in Google Ads were the ones generating the most page views per click. Those were not the campaigns with the highest actual sales conversion rates. The algorithm boosted bids on the page-view-heavy campaigns and reduced them on the sale-heavy ones. The mismatch between reported ROAS (50x) and actual ROAS (9x) is what that redistribution looks like at the top line.

Three months in: a stable pattern

We pulled the same data for February and March 2026 to check whether April was an outlier. It wasn’t.

MonthGoogle “Conversions”Actual sales (server-side)Ratio
February100,712(tracking not yet live)
March118,710258460x
April133,055668199x

The ratio improved from 460x to 199x not because the Google Ads configuration was fixed, but because server-side tracking caught more of the actual sales as it was rolled out across the customer’s site. The Google side has been wrong, consistently, for as long as we have records.

The other account in our audit with misconfigured tracking shows a similarly stable pattern — different magnitude, same structural issue every month. This isn’t drift. It’s the configuration doing exactly what it was set up to do.

How to check your own setup in five minutes

Open Google Ads. Navigate to Tools & Settings → Conversions → Summary. Look at the column labelled “Include in ‘Conversions’.” Filter to Yes.

You’ll see one row per Conversion Action that counts toward Smart Bidding’s optimisation target. Now look at the Category column:

  • Purchase — correct for e-commerce
  • Submit lead form — correct for lead generation
  • 🚨 Page view — incorrect; this is not a purchase
  • 🚨 Add to cart — incorrect; this is intent, not revenue
  • 🚨 Begin checkout — incorrect; same reason
  • 🚨 Add to wishlist — incorrect; same reason

If any of the four flagged categories are set to Include = Yes, your Smart Bidding has been optimising toward something other than completed sales. They can stay enabled as Secondary actions — they’re still useful as funnel signals for diagnostics — but they should not be in the bidding metric.

Then compare the number Google Ads reports as Conversions for the last 30 days against your back office order count for the same period. The ratio should sit between 0.9 and 1.1. Anything outside that window means there’s a measurement error worth investigating — in either direction.

The opposite failure mode

For most of the eleven accounts in our study, the problem isn’t over-counting. It’s the opposite: Google Ads sees a fraction of the actual sales.

One Nordic supplement retailer in our study has a clean conversion configuration — single Purchase action, properly categorised, no funnel pollution. In April, Google Ads recorded 2 conversions. The back office, measured server-side, recorded 32 sales. Google saw 6% of the truth.

Across the seven undercount cases, the visibility loss ranged from 6% to 56% — and the stability across three months was even tighter than for the over-count cases. Same percentage lost, every month.

When Smart Bidding believes a campaign produced 6% of its actual sales, it concludes the campaign is unprofitable and reallocates budget away from it. The campaign was working. The measurement wasn’t.

That’s the gap Digger was built to capture.

Why server-side data matters

The reason this case study could even be written is that we had a second source of truth running alongside Google Ads. Digger writes a server-side record of every form submission and every order, with the Google Ads ad ID and click ID captured at the moment of conversion. When Google Ads loses a conversion to cookie consent or ITP, Digger still has it. When Google Ads inflates a conversion by counting funnel steps, Digger’s record of actual orders stays grounded.

Without a second source, neither failure mode is visible. The dashboard says what it says. Smart Bidding believes what the dashboard says. The budget moves where Smart Bidding wants it to move. And the only signal that anything is wrong is a quarterly conversation with the finance team about why ROAS reports look great while bank balances don’t.

What to do next

If you’ve never audited your Conversion Actions, do that this week. Five minutes in the Conversions panel will tell you whether your Smart Bidding has been optimising toward sales or toward something else.

If the audit reveals a clean configuration but a wide gap between Google Ads conversions and back office orders, the failure mode is the inverse — server-side measurement is the only way to close it.

Either way: the AI is doing exactly what you’ve told it to do. The question is whether you’ve been telling it the right thing.

Frequently asked questions

How do I check if Smart Bidding is optimising toward page views?

In Google Ads, go to Tools and Settings, Conversions, Summary. Filter Include in Conversions to Yes. If any row has the category Page View, Add to Cart, Begin Checkout, or Add to Wishlist, Smart Bidding is bidding on something other than completed sales. Only Purchase (for e-commerce) or Submit lead form (for lead generation) should be included in the primary conversion metric.

What is the right ratio between Google Ads conversions and actual sales?

Between 0.9 and 1.1 over a 30 day window. If reported conversions are higher than back office orders by more than 10 percent, funnel events like Page View or Add to Cart are likely counted as conversions. If lower, client-side tracking is missing sales due to iOS Safari, cookie consent declines, or ad blockers.

Should I keep Add to Cart as a conversion in Google Ads?

Keep it enabled as a Secondary conversion action for diagnostic visibility, but remove it from the Include in Conversions metric that Smart Bidding bids on. Smart Bidding will optimise toward whatever is in the primary metric. Adding intent signals there pulls budget toward high-volume clicks instead of high-value clicks.

Why does my Google Ads dashboard show high ROAS while actual sales are flat?

Two common causes. Either funnel events are counted as conversions, inflating both the count and the assigned value, which is what produced the 50x reported ROAS vs 9x real ROAS in the case study. Or the dashboard is right about ROAS on tracked conversions, but a large share of actual sales never gets tracked, so the campaign appears to perform on a small subset of buyers. Server-side attribution catches both failure modes.


Get StartedBook a Free Demo

This article is part of a series on the gap between platform-reported and actual revenue. The precursor is how AI optimising perfectly toward the wrong customers shows up in a related failure mode. Next up: how Nordic e-commerce stores lose 30–94% of their sales to client-side tracking failures — and what that does to Smart Bidding’s budget allocation.

Methodology note: data drawn from eleven anonymised e-commerce accounts under one MCC, February–April 2026. Sources: Google Ads API (Conversion Action configuration and campaign metrics), Digger server-side attribution.
The Google Ads to back office gap was 199x on the case account, 460x the month before. Book a free demo to see what your number is.

How Much Conversion Data Are You Actually Losing? (And What It’s Costing You in Wasted Ad Spend)

How Much Conversion Data Are You Actually Losing?

You think you’re spending €10,000 a month on ads.

You’re not. You’re spending €10,000 but making decisions based on €7,000 worth of data. The other €3,000 is flying blind.

That’s not a metaphor. It’s what happens when your conversion tracking is broken. And right now, for most businesses running paid ads on Meta or Google, it is broken quietly, invisibly, and in ways that get worse every year.

Here’s what’s actually happening, what it costs you, and what you can do about it.

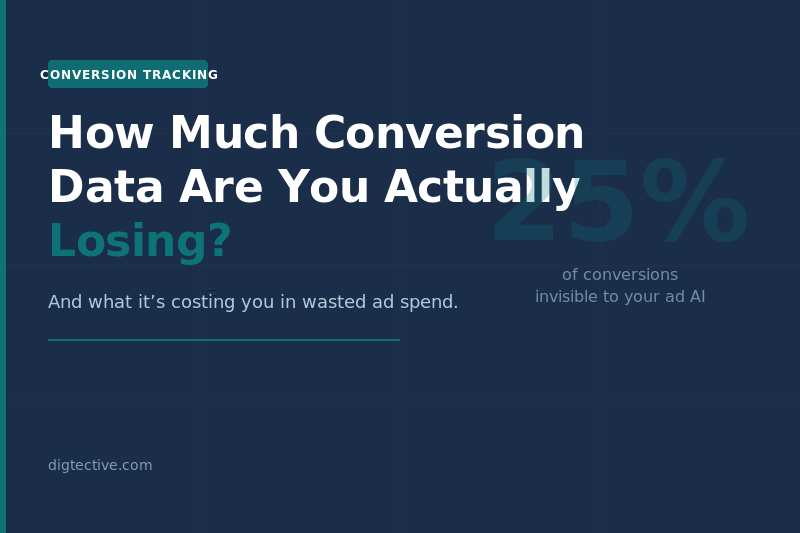
The Tracking Gap: Why 20–30% of Your Conversions Are Invisible

When someone clicks your ad and converts, a chain of events is supposed to happen: a signal fires, your ad platform records the conversion, and the algorithm learns from it.

But somewhere in that chain, for a significant portion of your customers, the signal never arrives.

The reasons stack up:

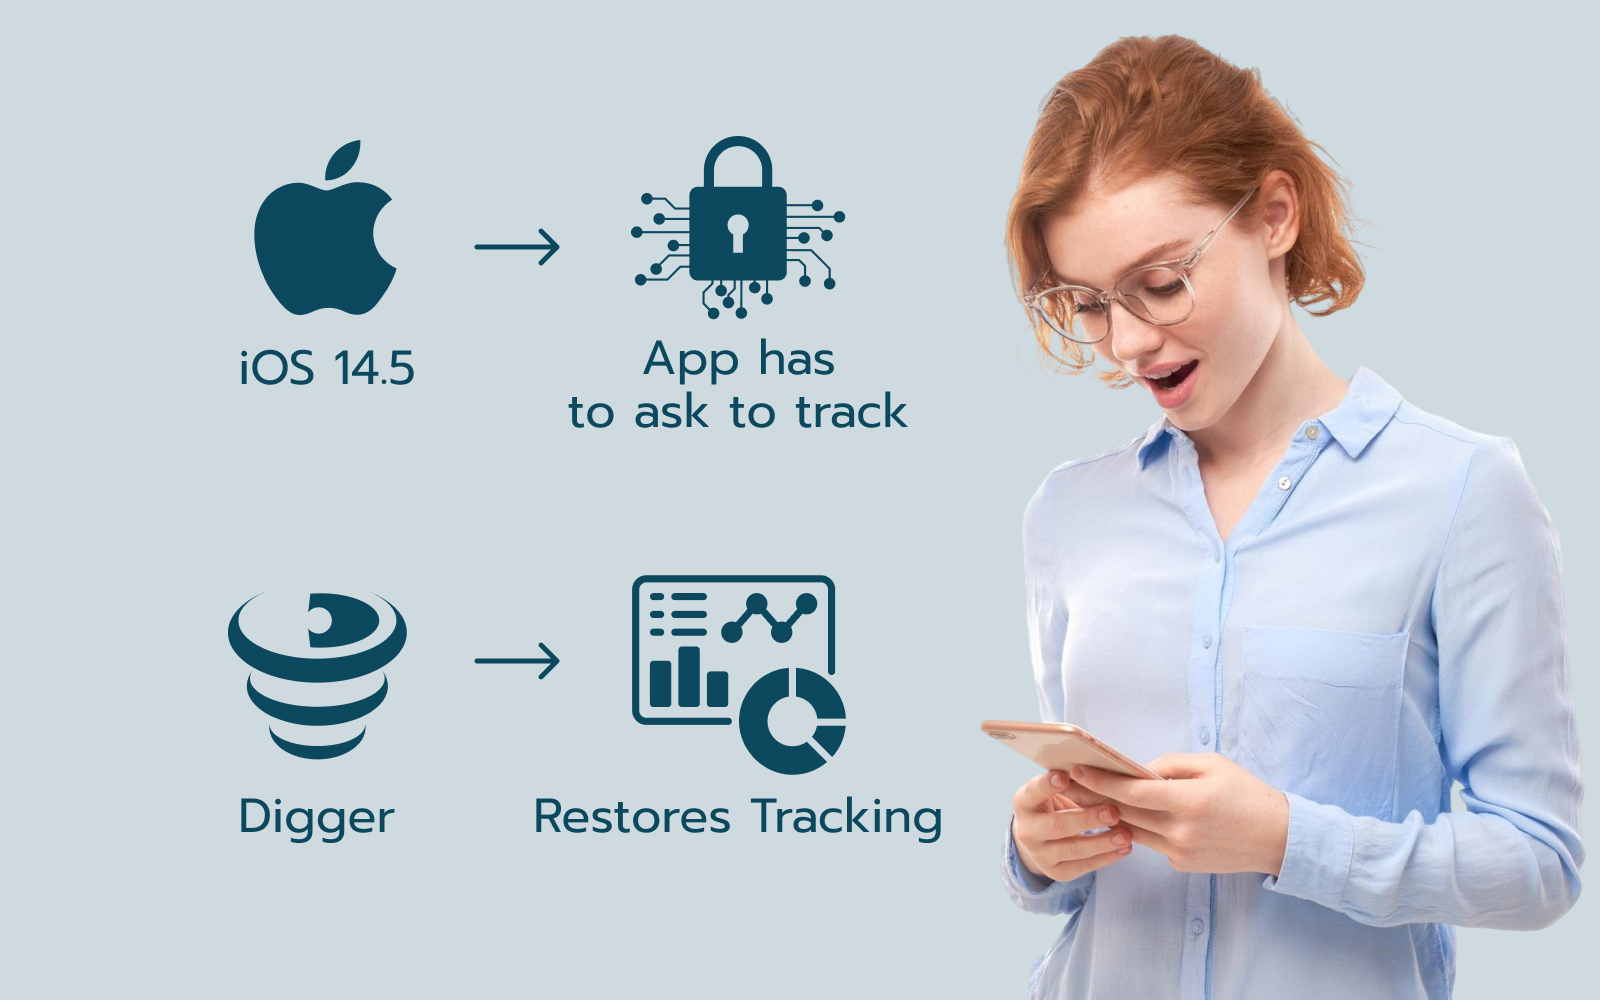
iOS 14.5 and beyond. Apple’s App Tracking Transparency framework, launched in 2021, cut the signal rate for Meta pixel events by an estimated 20–40% for iOS users. And iOS users are not a niche — they are often your highest-value customers.

Cookie blocking and browser privacy settings. Safari has blocked third-party cookies since 2017. Firefox followed. Even Chrome users increasingly use privacy extensions or settings that prevent pixel tracking. The result: a growing share of desktop conversions are also invisible.

Ad blockers. Roughly 27% of internet users run ad blockers, many of which also block tracking pixels.

Long sales cycles. If your customer clicks an ad on Monday and converts on Friday — or in three months — the pixel event fires in a completely different session, or not at all.

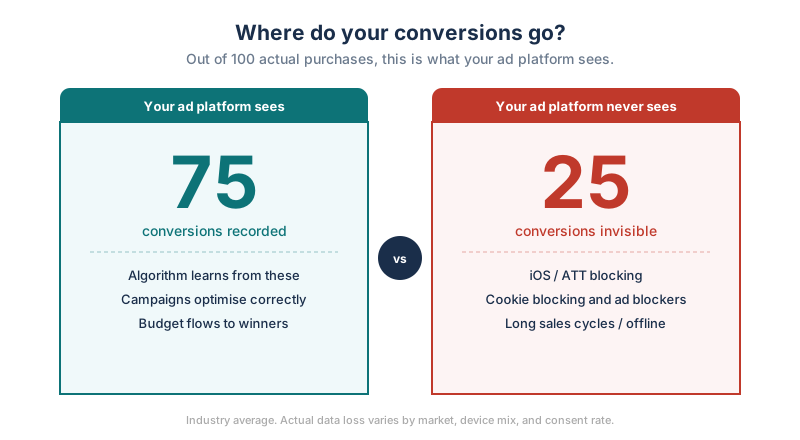
Add it up: independent studies and first-party data from tracking platforms consistently show that 20–30% of actual conversions never reach your ad platform. For B2B companies with long sales cycles, or businesses in markets with high iOS usage, that number can exceed 40%.

Where your conversions go: 75 recorded vs 25 invisible

This Isn’t Just a Reporting Problem

Here’s where most people misunderstand the cost.

They think: “OK, I’m missing some data. My reports look a little off. I’ll live with it.”

What they’re missing is that this isn’t a reporting problem. It’s a bidding problem.

Meta Advantage+ and Google Performance Max are not passive reporting tools. They’re active bidding algorithms. They decide in real time, for every auction — how much to spend on showing your ad to a particular person.

And they make those decisions based on the conversion data you send them.

When you’re missing 25% of your conversions, the algorithm isn’t just under-reporting. It’s actively learning the wrong things. It’s optimizing based on the customers it can see — which is a biased sample of your actual customer base.

  • Campaigns that look unprofitable but actually work get scaled back
  • Campaigns that look profitable but attract low-value customers get scaled up
  • You’re spending real money based on a fiction the algorithm built from incomplete data

This is what we call the Tracking Gap. And closing it is not about prettier dashboards — it’s about giving your ad AI the full picture so it stops wasting your budget on the wrong bets.

The bidding problem: 75% signal vs 100% signal

How Much Is It Actually Costing You?

Let’s make this concrete.

Say you spend €10,000/month on Meta ads. Your current reported ROAS is 3.0 — for every euro in, you get three back.

Now suppose 25% of your conversions are missing. That means:

  • Your actual ROAS is closer to 4.0 — you’re actually performing better than you think
  • But the algorithm is optimizing toward the 75% of conversions it can see — a biased sample
  • In the worst case, the campaigns with the highest share of invisible conversions look the worst in your account, and are being throttled or turned off

This is the most expensive version of the problem: you’re killing your winners because you can’t see them winning.

Even in a conservative scenario where the data loss just adds noise rather than systematically biasing results — you’re still working with an algorithm that has 25% less signal to learn from. That means slower optimization, higher CPAs, and more budget wasted during the learning phase.

For a €10,000/month account, a 25% reduction in conversion signal can conservatively translate to €1,500–€2,500/month in inefficient spend — campaigns that would perform better if the algorithm had full information.

At €120,000/year in ad spend, that’s potentially €18,000–€30,000 leaving the table annually. Not because your product or targeting is wrong. Because your tracking is incomplete.

Cost of broken tracking: EUR 30k annual waste

Why the Problem Gets Worse Over Time

This isn’t a problem you can wait out.

Each year, browser privacy standards tighten. Apple rolls out new restrictions. Consent rates for cookies in Europe hover around 60–70%, meaning a third of your European visitors are opted out of client-side tracking by default.

The ad platforms know this. Meta and Google have both said publicly that they depend on advertisers sending first-party conversion data via their Conversions API and the Google Ads API to compensate for what the pixel can no longer capture.

In other words: the platforms have already moved on from the pixel. The question is whether your tracking setup has moved with them.

If you’re still relying primarily on browser-side pixel events, the gap between your tracking data and reality grows a little wider every quarter.

What Closing the Tracking Gap Actually Looks Like

The fix is server-side conversion tracking: sending conversion events directly from your server to the ad platform API, rather than relying on a JavaScript pixel firing in the user’s browser.

Digger closes the gap completely:

  • It captures conversions server-side, so iOS restrictions, ad blockers, and cookie blocking cannot prevent the signal from being recorded
  • It doesn’t rely on the browser, so ad blockers and cookie blocking don’t affect it
  • It connects online ads to offline sales via API to your CRM or backend systems

The result in practice: up to 3x ROAS improvements have been observed across multiple customers who switched from pixel-only tracking to Digger. Not because their ads got better. Because the algorithm finally has the full picture.

For businesses with long sales cycles — real estate, finance, B2B SaaS, professional services — Digger also unlocks offline conversion matching: sending the confirmed sale back to the platform weeks or months after the original click, via direct API to your CRM. The algorithm learns which ad actually generated the customer, not just which ad generated a form submission.

GDPR compliance is built into the architecture, not bolted on. Digger processes pseudonymized data server-side, with you as the data controller.

The One Question to Ask About Your Current Setup

You don’t need to understand the technical details to know whether you have a problem.

Ask your team or your agency this: “How are we sending conversion data to Meta and Google — via pixel only, or via server-side API as well?”

If the answer is “pixel only” — or if they’re not sure — you’re almost certainly in the 20–30% loss range.

The cost of fixing it is low. The cost of not fixing it compounds every month.

Want to See Your Numbers?

We can show you in a 30-minute demo exactly how much conversion data your current setup is losing, and what it would mean for your ad spend if you got it back.

Book a free demo →

No pitch deck. No sales pressure. Just your actual data, and an honest conversation about whether server-side tracking makes sense for you.

Related reading: Why server-side tracking gives you a real ad advantage · How Neurogan recovered lost conversions and tripled revenue · Digtective integrations with Meta and Google

Frequently asked questions

How much conversion data does the average ecommerce site lose?

In our study of 11 ecommerce accounts, client-side tracking missed 30 to 94 percent of actual sales, depending on the share of iOS Safari traffic, cookie consent decline rates, and ad blocker usage.

What does this lost data cost in real terms?

When Google Ads sees 6 percent of actual sales, it concludes the campaign is unprofitable and reallocates budget away from it. The campaign was working, the measurement was not. Server-side tracking closes that gap.

Is there a quick test to see if I am affected?

Compare the number Google Ads reports as conversions for the last 30 days against your back office order count for the same period. The ratio should sit between 0.9 and 1.1. Anything outside that window means measurement error worth investigating.

How Three Companies Stopped Wasting 50-70% of Their Ad Budgets (Real Results)

Last month, an e-commerce company discovered they were spending $45,000 monthly on Google Ads keywords that generated zero sales. Not low ROI. Not break-even. Literally zero attributed revenue.

Their dashboard said everything was fine. Google reported healthy conversion numbers and a respectable ROAS. The problem? Their tracking was broken.

And they’re not alone.

The Problem No One Talks About

  • Your conversion tracking is probably missing 50-60% of your actual sales right now.
  • Every time someone on an iPhone buys from your ad, there’s a good chance you don’t see it. Cookie consent banners, privacy settings, iOS 14.5 restrictions, ad blockers – they all hide your real results from you. So you make decisions in the dark
  • You pause campaigns that actually drive revenue
  • You scale campaigns that lose money
  • You trust dashboards that show incomplete data

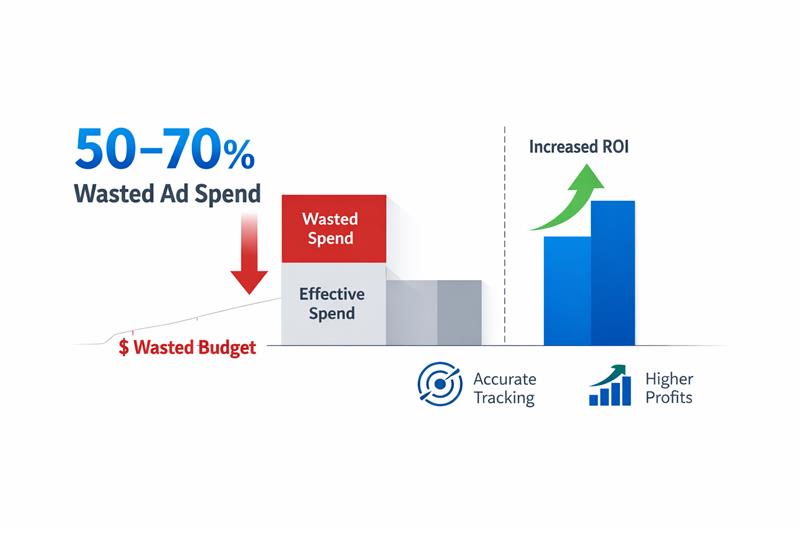
The average business wastes 50 to 70% of their ad budget this way. Every single month.

What Happens When You Finally See the Truth

We analyzed advertising data for three companies after implementing 100% accurate, cookieless conversion tracking. Then we used AI to process thousands of data points and identify what was actually working versus what was burning money.

Here’s what we found.

Case Study #1: E-commerce Health Supplements

The Situation

  • Monthly Google Ads spend: $67,000+
  • Google’s reported ROAS: 4.75 (looked profitable)
  • Problem: Revenue wasn’t growing with increased ad spend

What AI Analysis Revealed

When we tracked every conversion with 100% accuracy, the numbers looked completely different:

MetricGoogle ReportedActual Reality
Conversions6,5681,833 (only 20% of total)
Revenue from Google Ads$374,000$124,981
True ROAS4.751.85

But here’s the real discovery: 67% of their search terms generated zero attributed revenue.

They were spending $45,000 per month on keywords that never converted. Not occasionally. Never.

Meanwhile, their “Referral/Other” channel—which received almost no budget—was actually driving 44% of all revenue. Google Ads was getting credit (and budget) for sales it didn’t generate.

The Results

Armed with accurate data and AI-driven insights, they made three changes:

  1. Cut 70% of Google Ads budget from zero-revenue keywords
  2. Reallocated $45,000/month to the high-performing referral channel
  3. Doubled down on the 33% of keywords with proven ROAS

Outcome: – Profitability doubled while maintaining revenue – $45,000+ monthly savings from eliminated waste – Referral channel scaled from 44% to 60% of conversions – 2-3 weeks of manual analysis now automated to hours

Case Study #2: Scandinavian Fashion Brand

The Situation

  • Fixed monthly budget: $35,000 (Google Ads + Meta)
  • Problem: Revenue had plateaued despite consistent spend
  • Suspicion: Campaigns were inefficient, but couldn’t prove which ones

What AI Analysis Revealed

The AI uncovered a systematic misallocation problem:

  • 40% of campaigns generated zero revenue → Wasting $14,000/month
  • Meta showed 300 conversions, actual number: 45 (85% tracking gap)
  • Top-performing keyword had 8.9x ROAS → Receiving only 5% of budget
  • 3 campaigns drove 80% of profit → Receiving only 30% of budget

They were optimizing based on platform metrics that had no correlation with actual revenue.

The Results

They reallocated their $35,000 monthly budget based on actual profitability:

  • Paused all zero-revenue campaigns ($14,000 freed up)
  • Tripled budget on the 8.9x ROAS keyword (from $1,750 to $5,250)
  • Reallocated remaining budget to proven winners
  • Implemented weekly AI performance reviews

Outcome:100% sales growth with the same $35k budget – Setup completed in less than one day – Monthly profitability increased 140% – Customer acquisition cost reduced 47%

Case Study #3: B2B Software Comparison Platform

The Situation

  • Monthly spend: $245,000 across Google Ads
  • Problem: Revenue wasn’t scaling linearly with increased spend
  • Question: Why were some software categories profitable and others weren’t?

What AI Analysis Revealed

The company was treating all software categories equally, but profitability varied dramatically:

CategoryMonthly SpendROASStatus
ERP Systems$92,3303.50Highly Profitable
CRM Systems$45,0004.46Highly Profitable
Accounting Software$23,0002.68Profitable
HR Software$15,6700.85Loss Making
Marketing Tools$28,0000.23Severe Loss
Project Management$18,0000.45Loss Making
Other Categories$23,0000.60Loss Making

Strategic discovery: Three categories (ERP, CRM, Accounting) generated 92% of profit while consuming only 65% of budget. Four other categories collectively lost $46,000 monthly.

The company had achieved category authority in specific verticals but was subsidizing exploratory campaigns that would never be profitable at scale.

The Results

Based on AI recommendations:

  • Paused all loss-making categories (freed up $84,670/month)
  • Doubled budget on ERP Systems while maintaining ROAS
  • Increased CRM budget by 50% to capture market opportunity
  • Allocated remaining budget to testing adjacent categories one at a time

Outcome: – Blended ROAS improved from 2.08 to 3.4 – Monthly profit increased by $95,000 – Same revenue maintained with 35% less spend – Clear strategic direction for category expansion

The Pattern Across All Three Cases

These aren’t isolated examples. They represent a consistent pattern we see across every business we analyze:

Common Problems

  1. 50 to 70% of ad spend funds campaigns with zero attributed revenue
  2. Platforms credit “winning” campaigns that actually lose money
  3. Hidden channels drive 80%+ of real revenue without recognition
  4. Teams spend 2-3 weeks on analysis that AI completes in hours

Typical Results

  • 70% budget reduction with profitability doubling
  • 100% to 140% profit increases without spending more
  • Setup completed in less than one day
  • Continuous monitoring instead of quarterly reviews

Why This Matters Now

Your competitors who have solved the data problem now have a decisive advantage.

They know exactly which ads make money. They scale winners with confidence. They reallocate budget from losers instantly. They make decisions in hours that used to take weeks.

This isn’t about spending more on advertising. It’s about knowing the truth about your current spend.

The businesses in this report didn’t increase budgets—they reallocated them based on actual profitability data.

How It Actually Works

Traditional advertising analytics have been broken since iOS 14.5 and GDPR. Most businesses optimize campaigns based on incomplete data, often making decisions that hurt profitability.

The solution requires two components working together:

1. 100% Accurate, Cookieless Tracking

Server-side, cookieless tracking captures every conversion—even when users block cookies, use private browsing, or browse on iOS devices.

This isn’t an estimate or model. It’s 100% accurate attribution of every purchase or lead to its originating campaign, ad, and keyword.

Technical advantages: – Works in post-iOS 14.5 environment – GDPR and privacy-law compliant – No data loss from ad blockers or cookie consent – Granular attribution to keyword/ad level

2. AI-Powered Performance Analysis

With complete data in place, AI processes thousands of data points instantly to identify patterns, anomalies, and opportunities.

The system analyzes every campaign, ad group, keyword, and channel against actual revenue—not proxy metrics like clicks or platform-reported conversions.

What AI identifies: – Campaigns with zero attributed revenue (often 50 to 70% of budget) – Keywords with exceptional ROAS (400%+ returns) – Attribution gaps between channels – Positioning problems (low brand-search conversion rates) – Hidden winner channels receiving no credit

Why Both Components Matter

Without accurate conversion data, AI analysis is worthless. You’re just automating decisions based on incomplete information—garbage in, garbage out.

You need both: the foundation (100% accurate tracking) AND the intelligence layer (AI analysis) to make data-driven optimization actually possible in 2025’s privacy-first advertising landscape.

What You Can Do Right Now

If you’re spending $10,000+ monthly on Google Ads, Meta campaigns, or other digital advertising, there’s a high probability you’re experiencing the same issues as the companies in this report.

The question isn’t whether you’re wasting budget. The question is how much.

Three Options:

Option 1: Do Nothing Continue optimizing based on incomplete data. Keep funding campaigns that might not generate revenue. Hope your competitors don’t figure this out first.

Option 2: Manual Analysis Spend 2-3 weeks manually analyzing your conversion data. Attempt to identify patterns across thousands of data points. Repeat quarterly.

Option 3: Implement Accurate Tracking + AI Analysis Get the same foundation these three companies used. See exactly which campaigns drive revenue. Let AI identify opportunities and waste automatically.

Download the Complete Case Study (Free)

Want the full analysis including: – Complete methodology and technical implementation – Detailed breakdown of all three case studies – Step-by-step framework for identifying waste – AI analysis approach and recommendations – Common patterns across 15+ businesses

No credit card required. Instant access.

The Bottom Line

One client found $540,000 in yearly waste. Another doubled sales overnight. A third increased profit by $95,000 monthly.

Same ad budgets. Same teams. Same products.

The only difference? They finally saw where their money was actually going.

Your tracking is broken. Your competitors are fixing theirs.

What are you going to do about it?

About Digtective

Digtective provides 100% accurate, cookieless conversion tracking combined with AI-powered analysis for e-commerce businesses and B2B companies. We help businesses discover which campaigns actually drive revenue and which ones waste budget.

Ready to know the truth about your ad spend?
📧 Email: post@digtective.com
🌐 Website: digtective.com

Published: January 2026

Frequently asked questions

How much of an ad budget can server-side tracking save?

Across three real client accounts profiled in this piece, the recovered savings were 50 to 70% of total Google Ads spend by eliminating campaigns that appeared profitable in the dashboard but produced no actual sales server-side.

Why do some Google Ads campaigns appear profitable when they are not?

Smart Bidding optimises on whatever is set as a Conversion. If page views, add-to-cart, or begin-checkout events are counted as conversions, campaigns that produce traffic with no sales can show high reported ROAS while real ROAS is low or zero.

How fast do results show after fixing conversion configuration?

In the three case accounts, budget was reallocated within two to four weeks after correcting which actions were counted as conversions, with measurable ROAS improvement in the first month.

The tracking gap is costing most businesses 20–30% of their conversion data. Book a free demo to see your numbers — Book a demo

Your AI is optimising perfectly. Toward the wrong customers.

Why accurate conversion tracking determines who wins the AI advertising arms race

Here’s an uncomfortable truth: while you’re reading this, your competitors are feeding their advertising data to AI systems that optimise campaigns faster, smarter, and more ruthlessly than any human team ever could. Meta is pushing toward full ad automation. Google’s Performance Max and AI-powered campaigns are rewriting the rules of search advertising. The question isn’t whether AI will transform digital marketing. It already has. The question is whether you’ll be ready to compete.

But here’s what the platform evangelists won’t tell you: AI is only as good as the conversion data you feed it.

The shift to AI automation in Google and Meta ads

The industry is rapidly moving toward full automation. Meta has signalled that advertisers will soon be able to launch campaigns by simply inputting a business URL and budget. Their AI will handle everything else: creative generation, audience targeting, automated bidding, and performance analysis. No manual setup. No creative briefs. No media buyers required.

Google’s trajectory is similar. Performance Max already uses machine learning to deliver ads across Search, Display, YouTube, and Gmail from a single campaign. Their newer AI-powered features combine broad match targeting with generative AI to automate targeting, bidding, and creative customisation. The platform no longer waits for your keyword lists. It predicts user intent and matches your ads to searches you never thought to target.

These aren’t incremental improvements. They represent a fundamental shift in how digital advertising works. The platforms are building systems designed to outperform human campaign managers at every level of the funnel.

And they’re getting results. Google reports that advertisers using AI-powered Search campaigns see up to 14% more conversions compared to standard setups. Performance Max campaigns drive 27% more conversions at similar cost-per-acquisition. Meta’s AI-driven Advantage+ suite has fuelled explosive ad revenue growth, with the company now capturing 45 cents of every incremental advertising dollar spent online.

Why AI fails: the hidden cost of bad conversion data

Here’s where most businesses get it catastrophically wrong.

They hear “AI optimisation” and assume the technology will fix their campaigns. They enable Performance Max, activate Advantage+, and wait for the magic to happen. But the magic never comes. Or worse, it comes with devastating side effects.

The principle is as old as computing itself: garbage in, garbage out. Feed an AI system flawed conversion data, and it will optimise toward flawed outcomes with ruthless efficiency. The smarter the AI, the faster it scales your mistakes.

And here’s the problem: most advertisers are feeding their AI absolute garbage.

The signal loss problem

Since iOS 14.5 dropped in 2021, the digital advertising ecosystem has been flying increasingly blind. Apple’s App Tracking Transparency framework decimated Meta’s pixel tracking. Cookie consent banners now block 30-40% of conversions from ever being recorded. Browser privacy updates have made cross-device attribution modelling nearly impossible.

The result? The conversion data flowing into Google and Meta’s AI systems is systematically incomplete. And not randomly incomplete. Selectively incomplete in ways that skew toward certain demographics, devices, and behaviours.

When Performance Max optimises based on this distorted signal, it doesn’t find your best customers. It finds the customers whose conversions happen to be trackable. These are often very different groups.

This is the core of the ROAS accuracy problem. Your reported return on ad spend doesn’t reflect reality. It reflects the subset of reality your tracking can see.

What bad conversion tracking actually costs you

We’ve analysed hundreds of ad accounts across e-commerce, lead generation, and B2B verticals. The pattern is consistent and sobering.

Typically, 50-70% of advertising spend generates zero attributed revenue.

Not low ROAS. Not marginal returns. Zero. Meanwhile, a small subset of campaigns, often less than 10% of total spend, delivers extraordinary returns that get diluted by the underperformers.

One health products company we analysed had Google Ads reporting positive ROAS across all campaigns. Standard analytics painted a rosy picture. But when we implemented first-party conversion tracking and traced actual revenue back to ad spend, the reality was stark: most of their budget was haemorrhaging money, while a handful of campaigns were generating exceptional returns that the averages concealed.

The AI wasn’t broken. It was optimising exactly as designed, toward the incomplete, misleading signal it was receiving.

The competitive advantage no one talks about

This creates an unusual competitive dynamic.

Most advertisers are racing to adopt the latest AI features without addressing their foundational data problems. They’re building sophisticated houses on crumbling foundations.

The winners in this environment won’t be those who adopt AI fastest. They’ll be those who feed it the cleanest signal.

Think about what happens when you can track 100% of conversions while your competitors capture only 60-70%. Your AI optimisation starts with a 30-40% information advantage. Over time, this compounds. Your campaigns learn faster. Your targeting gets sharper. Your creative tests yield clearer insights. You can cut losers sooner and scale winners harder.

In the AI era, conversion tracking accuracy isn’t just a technical concern. It’s a competitive moat.

How first-party conversion tracking fixes AI optimisation

The path forward isn’t to resist AI. It’s to give it what it needs to actually work.

First-party conversion tracking circumvents the attribution blindspots created by browser restrictions and privacy regulations. Instead of relying on third-party cookies or pixel-based tracking that users can block, server-side tracking captures conversion data at the source: your own infrastructure.

This isn’t about circumventing privacy. It’s about accurate measurement that respects user consent while giving you the complete picture you need to make intelligent decisions.

The benefits of cookieless, first-party tracking:

  • 100% conversion visibility: Capture every sale, lead, and meaningful action, including those invisible to pixel tracking on iOS devices
  • Eliminates signal loss: No more 30-40% data gaps from cookie consent banners and ad blockers
  • Accurate offline conversion tracking: Connect revenue that happens days, weeks, or months after the click to the original ad
  • True ROAS accuracy: Know which campaigns actually drive profit, not just which ones appear to
  • GDPR and privacy compliant: Track accurately without compromising on data protection regulations
  • Better AI training data: Feed Google and Meta’s algorithms complete information so they can find more customers like your best customers

When you feed accurate conversion data back to the platforms, their AI systems can finally do what they’re designed to do: optimise toward real business outcomes, not distorted signals.

The results speak for themselves

We’ve seen businesses reduce cost per lead by 79% within three months of implementing accurate conversion tracking. Others have tripled revenue without increasing ad spend. One real estate finance company increased leads by 84% while reducing cost per acquisition by 86%.

The pattern is consistent: fix the conversion data, and the AI finally delivers on its promise.

The clock is ticking

The platforms are accelerating toward full automation. Every month you wait is a month your competitors are training their AI systems on better data while yours learns the wrong lessons.

The businesses that will dominate digital advertising in the coming years are making their data infrastructure decisions now. They understand that AI isn’t magic. It’s a multiplier. And multipliers work in both directions.

Multiply accurate data, and you get exponential improvement. Multiply garbage, and you get expensive garbage at scale.

The question you need to answer

Your competitor has AI. Or they’re getting it soon. The platforms are making sure of that.

The real question is: when their AI and your AI are both fully optimised, which one will be learning from better conversion data?

That’s the only advantage that actually matters now.

Ready to see what accurate conversion tracking can do for your campaigns?


Frequently asked questions

What does it mean that AI optimises toward the wrong customers?

When the conversion signal fed to Google Ads or Meta is incomplete or biased, Smart Bidding learns to bid for the kinds of users most represented in the truncated data. That often skews toward less valuable customer segments while ignoring high-value buyers whose conversions are lost to cookie blocks.

How do I tell if my AI is bidding for the wrong customers?

Compare the segments your back office sees buying (geography, channel, product mix) against the segments Google Ads reports as converting. If they diverge sharply, the bidding model is using a distorted signal.

How does server-side tracking fix this?

Server-side attribution captures every order with the ad click ID, then sends complete and unbiased data back to Google and Meta. The bidding model sees a true picture of which audiences actually convert.

What Happens to Your UTM Tags When Users Decline Cookies?

Marketers Love UTM Tags — Here’s Why

UTM parameters are a simple, powerful way to track where your traffic and conversions are coming from. They’re added to links in:

  • Google Ads & Meta campaigns
  • Newsletters
  • Influencer partnerships
  • Affiliate links
  • Organic social posts

When someone clicks a link with UTMs, the parameters (like utm_source, utm_campaign, utm_medium) tell your analytics tool what drove the visit. This allows you to:

  • Track ROI by channel
  • See what campaigns perform
  • Optimize budgets
  • Align marketing and sales

In short: UTMs are the foundation of marketing attribution.
But there’s a silent threat most marketers overlook.

In a perfect world, your analytics tool would remember that someone came from a Google ad — even if they buy a week later.
But we don’t live in that world anymore.

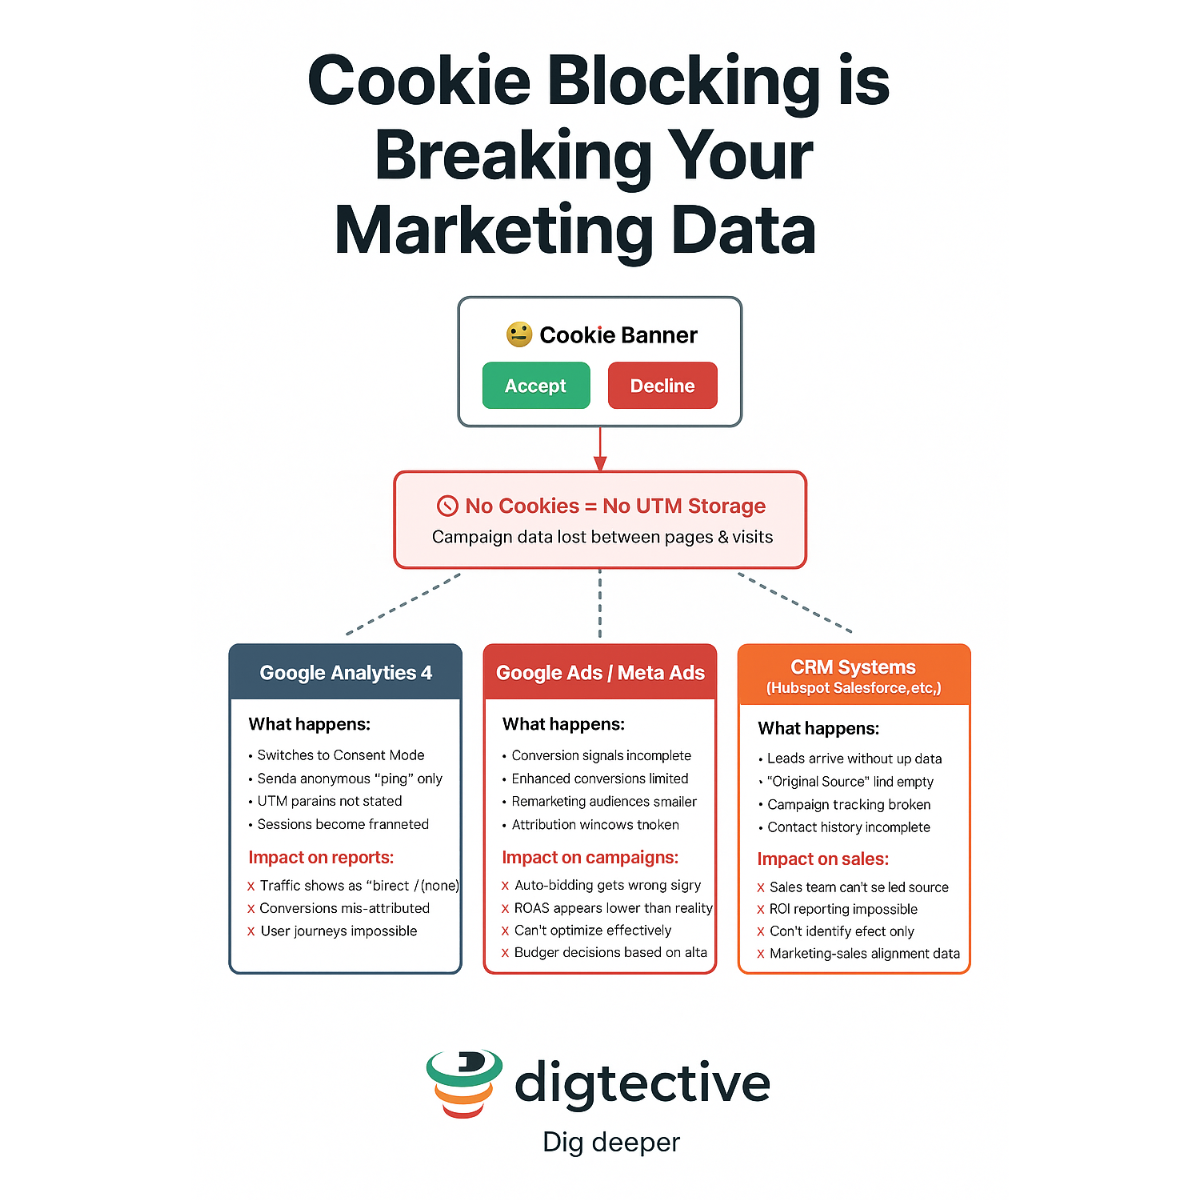
When a user lands on your site, your cookie banner shows up. If they decline, here’s what happens:

  1. No cookies can be stored
  2. No persistent UTM memory
  3. No cross-session attribution

The UTMs may be visible during that first visit, but as soon as they leave the site, the data is gone. If they come back and make a purchase later, analytics will have no idea where they originally came from.
Instead, the sale shows up as:

  1. Direct / None
  2. Unattributed
  3. Invisible to ad platforms

How Big Is This Problem?

This problem is not small. In Europe — where GDPR has been in force the longest — cookie rejection is the norm, not the exceptio

Overall European Behavior (Advance Metrics, 2024):

  1. 40.6% of users actively reject all cookies
  2. 25.4% accept all cookies
  3. 33.6% ignore the cookie banner entirely (which usually results in no consent)


Country-Specific Patterns

  1. Germany and France have the lowest acceptance rates in Europe, with users most likely to reject all cookies.
  2. In Germany, only 1.1% of users engage with detailed cookie settings — the highest rate in Europe.
  3. Switzerland shows just 0.8% engagement with cookie settings.

Device Differences:

  • On mobile, rejection rates skyrocket to 75%, compared to 41% on desktop.
    (Source: Tracking Cookies are Dead: What Marketers Can Do About It)

The Context:

Since GDPR took effect, European users have become far more privacy-conscious than users in the US or Asia. The data shows that between 40% and 75% of European users reject cookies, depending on the device and country.
This makes Europe the toughest region in the world for cookie-dependent analytics. And if your attribution relies on cookie consent, a massive share of your conversions is already going untracked.

What’s the Real Cost to Your Business?

When attribution breaks, the consequences go far beyond your own reporting.

  1. You can’t trust your conversion reports
  2. Profitable campaigns look like they’re underperforming
  3. Ad platforms like Google Ads and Meta receive incomplete data
  4. Their algorithms learn from the wrong signals and optimize in the wrong direction
  5. Budgets get pushed toward underperforming ads, while winning ads lose spend

In other words, it’s not just that you draw the wrong conclusions — your advertising platforms themselves are being misled.

This creates a vicious cycle: bad data → wrong optimization → declining performance → wasted budget.

The real cost is not only missed revenue but also campaigns that actively perform worse over time because the algorithms are trained on false feedback.

The Fix: Cookieless, Server-Side, First-Party Tracking

Here’s the good news: UTM data doesn’t have to disappear.

At Digtective, we’ve built a system that captures and stores UTM parameters without relying on third-party cookies — and in full compliance with GDPR and ePrivacy.

How?

  1. We store UTM parameters server-side when a user arrives
  2. We use short-lived, pseudonymized session IDs
  3. No personal data is collected without consent

Even if the user declines cookies, we can still connect the dots later — when they convert, days or weeks afterward. This means:

  1. 100% attribution — even from long sales cycles
  2. Better ROAS data in Google Ads and Meta
  3. Smarter budget decisions based on true performance
  4. Total compliance with privacy regulations

The Bottom Line

Most marketers are losing up to 30% of their attribution — without realizing it. Your UTM tags are only as good as your ability to store and use them.

If you’re relying on cookie-based analytics, you’re likely:

  1. Under-reporting your results
  2. Feeding poor-quality data to your ad platforms
  3. Making budget decisions with only half the picture

But with Digtective, you can:

  1. Track all conversions (even delayed ones)
  2. Respect user privacy
  3. Optimize with confidence

Ready to See What You’re Missing?

Get a live look at how Digtective can turn invisible conversions into actionable insights — without cookies.


Sources


Stop Fixing iOS Tracking Issues — Build a First-Party Data Advantage

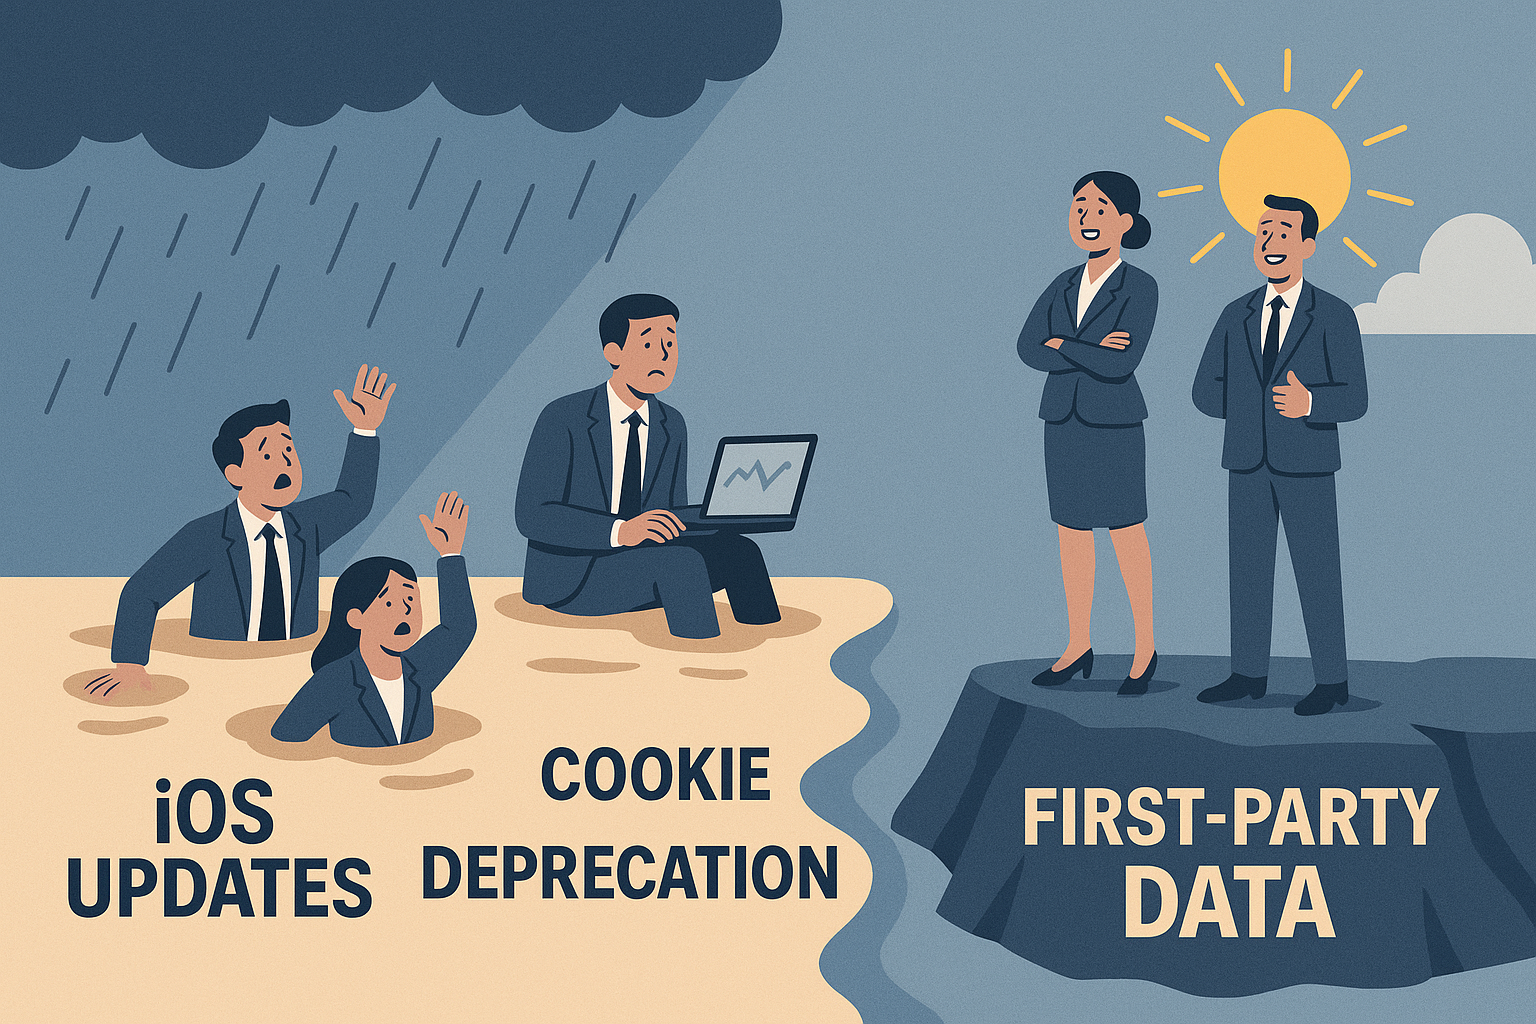
While you’re still fixing iOS 26 problems, your competitors are building measurement systems that never break.

Same Crisis, Same Response, Same Result

Year“Cirisis”Industry ResponseReality Check
2018GDPRConsent banners everywhereCookie acceptance rates: 90% -> 35-45%
2021iOS 14.5ATT ImplementationOnly 25% iOS users opted in
20213rd Party CookiesMore server-side trackingStill dependent on parameters
2025iOS 26Panic about gclid/fbclidSame pattern, different day

When will you stop fixing what’s designed to break?

The Reality Check You Won’t Like

Go into Shopify/WooCommerce and check actual sales for the last 90 days. Compare with what Facebook and Google Ads report as conversions.

The shock: Many discover that ad platforms report 20-40% MORE sales than actually happened.

Even worse: The sales that did happen aren’t attributed to the right ads. You’re not just burning budget on phantom sales—you’re also shifting budget away from what actually works.

Algorithms optimize toward conversions that don’t exist while starving the ads that drive real revenue. Your “smart” campaigns learn from completely wrong data.

While You Fix, We Deliver

Right now, your smartest competitors are scrambling to build what Digtective already has:

100% accurate sales data reported back to ad platforms
Complete customer visibility – not 45% fragments
Measurement that never breaks regardless of what Apple or Google do

Structural privacy compliance built in from day one

They’re spending months trying to build what we deliver today. We already have the unfair competitive advantage they’re desperately trying to create.

The Window Is Closing

You have 12-18 months before first-party data becomes standard, not advantage.

Companies building this NOW will dominate 2026-2030.
Companies still fixing iOS problems will be acquisition targets.

100% Accurate Data. Available Today.

You don’t need to build what your competitors are still trying to figure out. Digtective has already solved it:

Accurate Measurement: Every dollar you spend on ads gets reported back with pinpoint precision at the ad level. No more phantom sales.

Complete Picture: See all your customers, not just the 45% who accept cookies. All behavior, all touchpoints, all data.

Future-Proof: Measurement independent of iOS updates, cookie regulations, or platform changes. Built for the next decade.

Immediate Implementation: Not 6 months of development. Not hoping the next update works. Results from day one.

The Question Isn’t IF, But WHEN

Your competitors are already moving. Every day you wait is another day they build bigger advantages.

What happens when they have 100% accurate data and you’re still guessing based on fragments?

Budget meetings become uncomfortable. Performance reports become hard to explain. Growth targets become impossible to hit with broken data.

Stop Fixing. Start Building.

While your competitors keep patching the same broken system, you can build something that actually works.

Call today. See how Digtective gives you 100% accurate data from day one, while your competitors are still wondering where their traffic really comes from.

The window is open. But not for long.

Ready to see how 100% accurate data transforms your marketing? Your competitors aren’t waiting. Why are you?

Frequently asked questions

Why is iOS breaking my conversion tracking?

iOS 14.5 introduced App Tracking Transparency and Intelligent Tracking Prevention, which limit third-party cookies and pixel-based attribution in Safari. Subsequent iOS versions tightened those restrictions further.

What is first-party data and why does it solve the iOS problem?

First-party data is information captured by your own site or server, not by a third-party pixel. It is unaffected by Safari restrictions because it never relies on third-party cookies in the first place.

How does Digger implement first-party tracking?

Digger captures every conversion server-side at the moment of order or form submission, then sends the data to ad platforms via their own server-side APIs (Google Enhanced Conversions, Meta Conversions API). No browser pixel is required.

What are you waiting for?
Track with precision, convert with confidence, and make every ad dollar count.

Surviving and Thriving in a Post‑iOS 26 World: The Marketer’s Guide

We’ve been tracking Apple’s privacy updates closely ever since iOS 14.5 turned Facebook Ads upside down. When iOS 15, 16, and 17 rolled out, we were already helping clients prepare. Now, with iOS 26 about to land, we’ve been digging deep into what’s changing — long before Apple unveils iOS 28.

Why? Because every new release pushes marketers further into the dark. Link tracking gets stripped. Fingerprinting is blocked. Cookies are already dead. And with each update, more of your conversions vanish from your reports.

The result is simple: without a future-proof solution, advertisers lose visibility, waste budget, and miss growth opportunities. However, there is a way to stay ahead. In fact, it’s already available.

iOS 26’s Privacy Crackdown: What Changed?

Apple has made it clear that tracking users across apps and websites will only get harder. Specifically, two major updates stand out:

  1. Advanced Fingerprinting Protection. Safari now blocks many fingerprinting techniques by default. This applies in both normal and private modes. Device clues like screen resolution, fonts, and CPU cores get scrambled. As a result, they are unreliable for tracking. In short, fingerprinting is going extinct.
  2. Link Tracking Protection. Safari strips tracking parameters from URLs. This happens in Mail, Messages, and Private Browsing. Parameters like gclid, fbclid, and utm_* may never reach your site. Consequently, you lose visibility into the campaign that drove the visit. In turn, this weakens your ability to optimize.

Together, these updates take away the last remnants of traditional tracking. In other words, they close every loophole advertisers once relied on.

Why This Triggers an Attribution Crisis

The impact on marketers is huge:

  1. Conversions go dark. Many brands already lost 20–30% of conversions with iOS 14.5. Now, even more will disappear. For example, up to 40% of your iPhone conversions may be untracked. As a consequence, reports become dangerously misleading.
  2. Ad spend is wasted. As a result, when attribution breaks, marketers often cut campaigns that are actually profitable. False negatives cause budgets to shift away from what’s working. Ultimately, this reduces growth instead of supporting it.
  3. Algorithms weaken. Google Ads and Meta Ads rely on conversion data to optimize. Without enough signals, CPAs rise and ROAS falls. Moreover, algorithms can no longer target your best customers effectively.
  4. Illusion of decline. Campaigns may look weaker simply because reporting is incomplete. In reality, sales still happen, but you can’t see them. In turn, this creates the illusion of poor performance.

Therefore, marketers are left flying blind. Above all, they risk making decisions on broken data.

Legacy Tracking is Dead

Traditional methods no longer work:

  1. Cookies: Safari and Firefox already block third-party cookies. Chrome is phasing them out too. Moreover, even first-party cookies get capped, which shortens attribution windows dramatically.
  2. Click IDs: Apple strips out gclid, fbclid, and similar IDs. As a result, Google Ads and Meta attribution pipelines break. In other words, your ad spend goes uncredited.
  3. Fingerprinting: Safari randomizes device details. Consequently, fingerprinting is no longer a viable workaround.
  4. Device IDs: App Tracking Transparency already killed IDFA for most users. Instead, marketers were pushed toward server-side APIs and SKAdNetwork.

In summary, Apple is dismantling every workaround that tries to follow users without consent. Therefore, a new approach is essential.

How Digger Solves the iOS 26 Challenge

Instead of patching broken systems, Digtective’s Digger takes a new approach.

  1. Server-side tracking. Events are captured directly on your server. This means they bypass browser restrictions and ad blockers. As a result, no conversion gets lost.
  2. No cookies or fingerprints. Digger is 100% privacy-first and GDPR-compliant. Therefore, there is nothing for Safari to block. In addition, compliance teams can sign off with confidence.
  3. Deterministic attribution. Click data is stored server-side, then matched to conversions. As a result, you see exactly which campaign drove the sale. Importantly, this happens without fragile browser IDs.
  4. Platform integrations. Digger pushes conversions back to Google, Meta, and others via server-side APIs. Consequently, algorithms get the full data picture again. In turn, campaign performance improves.
  5. Future-proof. Built for a cookieless world. In fact, it’s ready for iOS 26 and whatever comes next.

Recover Lost Conversions and Maximize ROAS

With Digger, marketers:

  1. Capture 100% of conversions. Even the 30–40% that go dark with iOS are recovered. As a result, you regain full visibility.
  2. Trust their data. Every sale and lead is tied back to the right campaign. Therefore, reporting becomes accurate again.
  3. Optimize with confidence. Budgets go to the campaigns that truly deliver ROI. In addition, wasted spend is cut dramatically.
  4. Feed the algorithms. Google and Meta’s bidding models improve with better data. As a consequence, CPAs drop and ROAS climbs.
  5. Stay compliant. Privacy and performance go hand in hand. Above all, you remain future-proof.

Brands using Digger have cut CPA by up to 80% while scaling leads and revenue. For instance, some saw conversion costs fall by nearly 79% in just three months.

Conclusion: Don’t Let iOS 26 Leave You in the Dark

Apple’s privacy moves are here to stay. Therefore, the only way forward is cookieless, server-side, first-party tracking. That’s exactly what Digger delivers.

👉 Ready to illuminate your “dark” conversions and supercharge ROAS?

Book a demo with Digtective today.

Sources

Boost Your Meta Ads Performance with Digtective’s New Conversion API Integration

Boost Your Meta Ads Performance with Digtective’s New Conversion API Integration

We’re excited to introduce a powerful new feature in Digtective: native support for the Meta Conversion API!

This update allows you to send high-quality conversion events directly from your server to Meta (Facebook), improving attribution accuracy and ad performance—especially in the age of increasing tracking restrictions and iOS privacy changes.

Why This Matters

Traditional browser-based tracking (like the Facebook Pixel) is no longer enough. Browser events can be blocked, delayed, or distorted by ad blockers and privacy settings. With Meta’s Conversion API (CAPI), you can now bypass these limitations by sending conversion data server-side—making it more reliable and more complete.

If you’d like to dig deeper into how iOS updates disrupted Facebook ads tracking—and how Digtective stepped in to help—check out our previous post:

How iOS 14.5 Broke Facebook Ads (and How We Fixed It)

By combining browser-based tracking and server-to-server event transmission, our new CAPI integration helps you:

Recover lost conversions due to browser tracking issues

Improve signal quality for Meta’s ad algorithms

Optimize campaign performance with more accurate data

• Reduce CPA by giving Meta better data to work with

Who Is It For?

This feature is ideal for ecommerce sites using WooCommerce, Shopify, or custom solutions—especially if you’re already using Digtective for tracking and attribution. Now, with just a few extra steps, you can enable CAPI without complex coding or relying on bulky plugins that slow down your load times.

How to Set It Up

We’ve made it simple. Just follow our step-by-step guide:

How to Add Meta Conversion API to Digger

All you’ll need is your Meta Pixel ID and an access token from Meta Events Manager. Once configured, Digtective will send key events like purchases, leads, or other conversions directly to Meta—server-side—while still retaining browser-side tracking for completeness.

Start Getting Better Results Today

Adding Meta’s Conversion API is one of the best ways to increase ROAS and stay competitive in today’s privacy-first ad landscape. And now, it’s easier than ever—thanks to Digtective.

Have questions or want help setting it up? Contact us, and we’ll walk you through every step.

Book a 15-minute Demo & Free Audit

See exactly where your tracking gaps are—and how to fix them.

How iOS 14.5 Broke Facebook Ads and How We Fixed It

What Did iOS 14.5 Change - and Why Does It Matter for Marketers?

With the release of iOS 14.5, Apple introduced App Tracking Transparency (ATT) – a major privacy update that forced all iOS apps to ask for user permission before tracking behaviour across apps and websites, making iOS 14.5 Facebook tracking nearly impossible. When given a choice, most users choose to decline being tracked, which results in:


• Blocked access to the Identifier for Advertisers (IDFA)
• Breakage of traditional attribution methods for platforms like Facebook Ads
• Harder optimization of ad campaigns based on real results

Thus, marketers lose visibility into conversions, especially on iPhones, creating a loss of valuable data. This loss of data can be equivalent to as much as around 40% of the conversions, and one’s advertising is only as good as the data it relies upon. It is therefore crucial to regain this lost data in order to accurately optimize one’s advertisement and ad spend to increase conversions and growth.

How iOS 14.5 Impacts Facebook Ads Attribution

Facebook (now Meta) relied heavily on IDFA to attribute app installs, purchases, and other conversions. With ATT in place, this becomes almost impossible on iOS devices as most users choose to opt out. As a consequence of this:

• Conversions from iOS users go untracked or misattributed
• Attribution windows shrink (e.g. from 28-day to 7-day click)
• Reporting is delayed, aggregated, and often inaccurate
• Retargeting audiences shrink, impacting performance

Furthermore, a common misconception is that the Facebook pixel will remedy this loss of data and become a good solution for “iOS 14.5 Facebook tracking”, which is not the case. The Facebook pixel struggles to:

• Track users accurately on Safari and iOS
• Pass first-party cookies consistently
• Attribute events to the correct campaigns

Thus, your return on ad spend (ROAS) may appear lower than it actually is – leading to inaccurate bad optimization as it is done on inaccurate data.

Digger: A Modern Attribution Tool for a Post – iOS 14.5+ World

At Digtective, we built the conversion tracking tool called Digger to solve the exact attribution problems caused by new privacy regulations and solutions such as iOS 14.5+, Safari restrictions and GDPR.

How Digger Works:

✅ Server-Side Tracking which is GDPR Compliant

Instead of relying on browser-based pixels, Digger sends conversion data directly from your server to ad platforms like Meta. This bypasses client-side blocks and ensures conversions are captured. Digger is also cookieless and GDPR compliant, removing the stress of heavy fines and social scrutiny.

✅ First-Party Attribution

Digger uses other privacy-compliant identifiers to match conversions – even when IDFA or cookies aren’t available.

✅ Real iOS Visibility

You’ll finally know what’s working on iOS again. Digger shows which campaigns drive real purchases – including those invisible to pixel tracking.

✅ Easy Meta Ads Integration

Digger integrates natively with the Meta Conversions API, so you can restore tracking accuracy without developer headaches.

With the use of Digger, marketers can finally regain the ability to accurately track conversions and optimize their ad spend. Identify the ads that are profitable and the ones that aren’t. Cut the unprofitable ads and reallocate the ad spend to the ads that do work to increase your growth and scale faster. Your ads are only as good as the data that they are based upon!

Who Needs Digger?

Digger is a tracking tool suitable for all marketers eager to scale and increase their growth. In terms of iOS, If you’re doing any of the following, you’ll benefit from Digger’s iOS tracking solution:

• Running Facebook or Instagram Ads to drive sales
• Managing a WooCommerce or Shopify store
• Losing conversion visibility from iOS or Safari users
• Using tools like PixelYourSite, but still seeing gaps

To conclude – This is How to Fix Your iOS Tracking and Get Attribution Back

Here’s what you should do today:

  1. Stop relying only on browser-based pixels
  2. Implement server-side tracking with Digger
  3. Verify your events in Meta Events Manager
  4. Monitor iOS conversions and ROAS again with confidence

Apple’s privacy updates have changed digital marketing forever, and they’re here to stay! However, this doesn’t mean that you have to fly blind! With Digger, you can reclaim visibility into your ad performance, optimize your ad spend and scale with confidence, all while simultaneously staying cookieless and GDPR compliant.

Frequently asked questions

What changed in iOS 14.5 for Facebook Ads?

iOS 14.5 required users to opt into app tracking via the App Tracking Transparency prompt. With most users declining, Facebook lost the ability to attribute conversions back to ad clicks for Apple users in apps and Safari.

How much attribution did Facebook Ads lose?

For Nordic ecommerce accounts measured in our case studies, Facebook attributed conversions dropped 50 to 80 percent for iOS traffic compared to pre-iOS 14.5 levels.

What is the Conversions API and how does it help?

Meta Conversions API is a server-side endpoint that accepts conversion data directly from your backend. It bypasses browser-based tracking entirely. With Digger, every order is sent to Conversions API at the moment of purchase, restoring lost signal.

Book a 15-minute Demo & Free Audit

See exactly where your tracking gaps are—and how to fix them.


Only 6.34% of ads generate profit

Most of your ads are not profitable.

Over the last few years, Digtective has tracked over a million conversions using our server-side, cookieless tool. Our clients range across several industries but concentrate on financial services and real estate. To celebrate hitting the magic million number, we’ve deep-dived into the data to see what we – and therefore you – can learn from it.
Most of our clients operate businesses with longer and more complex sales cycles than your typical online store, such as loan intermediation, real estate agencies, or consultancy businesses. This means that tracking conversion is more complicated than just seeing who clicked on an advert. After the customer has submitted an application form for a loan, for example, the application has to be forwarded to the appropriate bank, the bank has to consider the application, and only if the loan is approved and the customer accepts the terms, does the intermediary get paid. While this can be a matter of minutes, it can also be a matter of months. Digtective’s tracking of these offline conversions is essential to direct your advertising spend to the right ads.

Most of your conversions don’t make you any money.

You already know that no one clicks on most of your ads – click-through rates are usually low for most channels. Once they’ve clicked on your ad and come to your goal page, though, how many actually turn into revenue? Our numbers indicate that this varies between and within customer segments, but the average is 6.4%. The range is from 2,7% to 11,3%.

*  Note that some clients have proprietary channels ranking in the top 10, which are therefore hidden in the table.

The segments with the highest ratio of conversion to income are those where the end customer’s sense of urgency is highest: one client is a chain of dentists, others are banks and loan brokers specializing in refinancing distressed borrowers. Searching for a dentist or an expensive last-resort-mortgage is clearly not something people do casually … the loan brokers with low conversion rates are those who are active in crowded markets such as credit cards and consumer loans. The variation within each category is also interesting, implying that the quality of your adverts, the target market you are addressing, or other factors are impacting it.

Another interesting finding is that, for most of our clients, the best source of leads is in fact direct. Table 2 (above) shows, for a selection of clients (all from the financial services sector), which lead sources have the highest net income per conversion (i.e. income from the transaction minus the cost of the advert or lead). No average has been calculated (since the clients all have different numbers of total lead sources) direct is clearly the top source. Table 3 shows this quite clearly when looking at the aggregate numbers across the whole sample of clients. This is true even for those whose brand names are not well known in their market, indicating that doing a good job on SEO is a very worthwhile effort.

From our perspective it is also interesting to see how much the ROI on advertising spend differs between clients. As for most SaaS companies, we know that there is great variability in how active our clients are in using our software. Unlike most SaaS companies, we can compare the frequency of logging in with the effectiveness of our product! Of the four clients whose data we have used for the two above tables, two are active users of the service, checking their ads daily and cutting those which are not profitable. The other two have been more passive, allowing us to track their conversions without actively going in to focus their spending on effective ads. This is clearly visible in what return they are getting on their advertising spend:

The numbers you see in your analytics aren’t the full picture

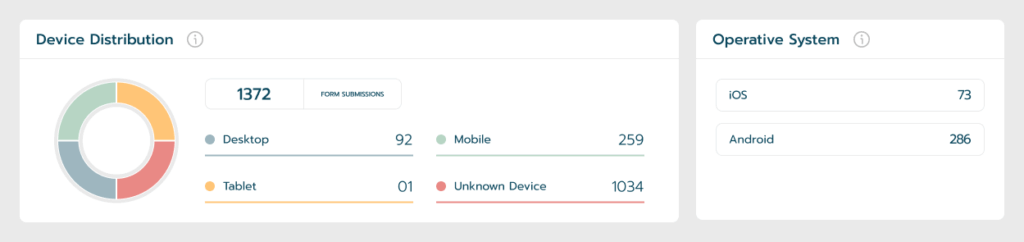
The growth of ad-blockers and “do not track” means that Google Ads is missing more and more of your traffic and conversions. In addition, the use of cookies is becoming more and more difficult. Because our tool counts form submissions server-side, we can track those customers whose browsers do not allow cookies (while still being GDPR and privacy-compliant by avoiding the association of the conversion to any personal data about the customer). Over time, we have seen a significant gap between form submissions as counted by Google Ads, versus the full picture which our tool gives:

This indicates that Google Ads misses a huge number of conversions. This is of course an issue for those wanting accurate data to guide their advertising, but is an even bigger problem for those trying to create machine learning algorithms to automate this process.

What’s even worse is that many clients set up their Google Ads to track many different actions as a conversion – which is fine if you want to measure the performance of your webpages, but not if you’re looking to maximise your revenue. Defining “Youtube channel subscription” as a conversion will help you grow your YouTube channel, but will give you a very noisy dataset. As Cassie Kozyrkov says, the essence of ML and AI is “Optimize [this goal] on [this dataset]” – if your dataset is missing 30% of the full picture, or if the goal is unclear, you’re likely to end up with a bad algorithm. This has been adjusted for in the above table for Client C, which has a very broad definition of conversions in their Google set-up.

How we are developing our tool in response

The core of Digtective’s offering has been the Digger tool to track ad spend and profitability, reducing cost per lead and allowing you to focus your spending on the ads which perform best. However, as the death of the cookie and the growth of no-track has progressed, we have seen that we can provide an important service also to clients who just want to have accurate data in their analytics solution. We have therefore developed a service which feeds our conversion tracking back into Google Ads, allowing you to see the full quality of Digtective data in the interface you are already using. This also allows better training of any algorithms you may have for optimizing your ad spending.

To enable the widest possible adoption of this, we provided this in a “Digger Lite” subscription, where a monthly fee of EUR 50, rather than the full Digger subscription fee from EUR 1000. We are confident that seeing the true numbers will also increase interest in the full service, allowing more customers to reduce their marketing spend.

Big thanks to Jakob Bronebakk, CFA for his analysis. Jakob is an independent strategy consultant with a focus on using technology and data science to improve financial services.

Jakob was a cofounder of MyBank ASA, and served as its CFO and then CEO. He has held CFO positions in other financial services companies, prior to which he worked as a derivatives specialist at investment banks in London. His preferred habitat is steep, mountainous terrain, but can also be found in front of large spreadsheets or building machine learning models. 

Learn more and reach out to Jakob on LinkedIn.